
Newsletter Subscribe
Enter your email address below and subscribe to our newsletter

In the last article, we introduced the three pivotal investment decisions. This article will dissect how cyclical investors can harness these principles: what, how much, and when to buy. First, an introduction to a crucial concept for cyclical investors: mean reversion.
The principle of mean reversion, highlighting that asset prices and returns gravitate back to their long-term average, plays a crucial role in navigating market cycles. It aids in pinpointing investment opportunities and assessing risks, underlining the inevitability of extreme conditions reverting to their historical norms.
For instance, One man was feeling depressed and decided to reach out to one of his friends to talk about it. During their conversation, the friend listened attentively and sympathetically to his concerns. A few days later, he was pleasantly surprised that his long-term back pain had significantly improved. This phenomenon leads many to mistakenly believe in the healing power of verbal communication and emotional exchange for their pain. However, this is an example of mean reversion. The individual’s pain intensity had reached an extreme peak, and naturally, regardless of visiting a psychologist, their level of pain was likely to decrease on its own. This alleviation is not due to the treatment or conversation’s direct effect but to the pain level’s natural adjustment back to a lower state.
Some believe that for students who perform exceptionally well, once they receive praise, their grades might decline. Conversely, criticizing students with poor grades seems to elevate their performance. In reality, when a student has reached a peak level, they have a greater chance of a slight decline in grades since they are already at the top. Conversely, when a student’s grades are at their lowest, the likelihood of improving their grades is naturally much higher than their performance worsening further. This is a natural cycle of mean reversion, not directly caused by praise or criticism.
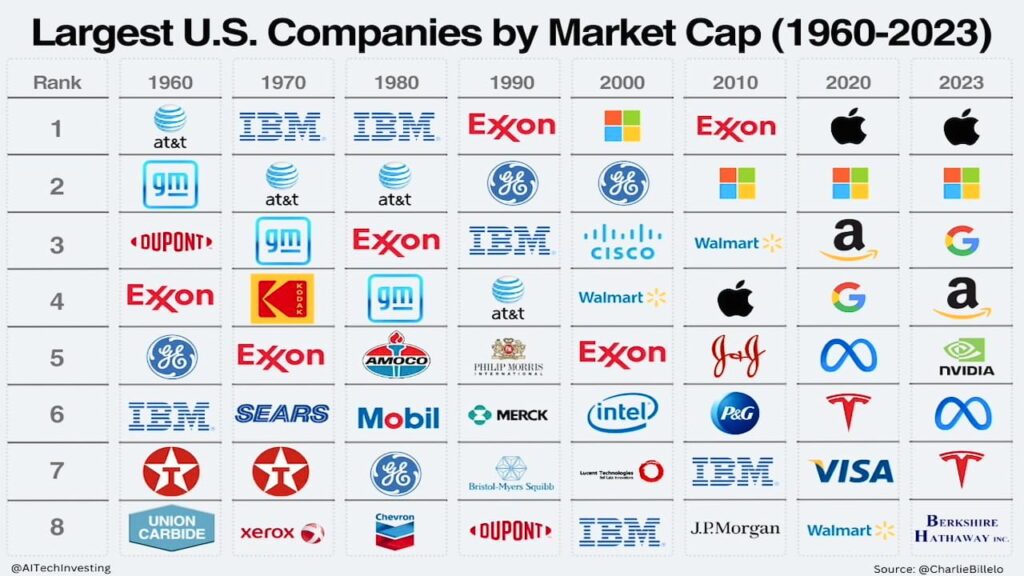
Charts reveal that the largest U.S. companies by market capitalization undergo significant changes every decade.
In the 1990s, IBM and ExxonMobil led the U.S. to the forefront of global market capitalization. At that time, the technology and energy sectors began to show their economic impact. By 2000, with the rise of the tech industry, companies such as Microsoft, General Electric, Cisco, Walmart, and Intel dominated the market cap front, marking the internet’s and personal computers’ profound influence on society.
The 2010s witnessed the coexistence of technology and energy firms, with ExxonMobil and tech giants like Microsoft, Apple, and Google, indicating the rise of mobile internet and the digital economy. By 2020, tech companies such as Apple, Microsoft, Amazon, Google, and Meta Platforms led the market, highlighting the importance of digital transformation and social media while also reflecting the growing influence of technological innovation in the global economy.
These shifts reveal a core principle in investing: the long-term performance of individual stocks is difficult to predict. Even seemingly invincible companies may face mean reversion adjustments. Thus, investing in ETFs or funds, which naturally adjust asset allocation, can be wise to mitigate the high risks associated with individual stocks and capitalize on the investment opportunities presented by mean reversion.
Cyclical investors’ asset allocation focuses not solely on the performance of a single asset class but on flexible adjustments across different market conditions. By seizing low-buy opportunities, capital flows between stocks, ETFs, and government bonds are optimized, achieving a balance and substitution among assets. This strategy aims to diversify risks and maximize returns, achieving a dual goal.
The operation of the U.S. stock market often exhibits a characteristic of “long bull, short bear”: bull markets are lengthy and gradual, while bear markets are brief yet intense, often erasing the gains of the previous one to two years within weeks. In more extreme cases, a severe systemic risk could wipe out a decade’s growth in a few months.
Cyclical investors in the U.S. stock market typically focus on representative stocks or index funds, such as SPY, QQQ, and SOXX. These instruments represent the largest market cap companies and serve as tools for investors to engage in cyclical investing.
| ETF | BENCHMARK | Assets | Expense Ratio | Inception Date | Trailing Returns(10-Year) |
|---|---|---|---|---|---|
| VTI | CRSP U.S. Total Market Index | $1470 B | 0.03% | 2001-05-24 | 11.19% |
| SPY | S&P 500 Index | $489 B | 0.09% | 1993-01-22 | 12.51% |
| QQQ | Nasdaq-100 Index | $243 B | 0.20% | 1999-03-10 | 18.11% |
| SOXX | NYSE Semiconductor Index | $11 B | 0.35% | 2001-07-10 | 24.83% |
Management fees are a critical factor in selecting ETFs. Generally, the management fees of ETFs tend to increase with their size, reflecting that they have attracted significant capital. In contrast, lower management fees make them more cost-effective, although this may imply lower trading volumes and potential liquidity issues. However, observations have shown that the trading volumes of these ETFs still meet investment standards, making them suitable choices for cyclical investing.
Beyond stocks and index funds, cyclical investors also hold U.S. Treasury bonds as part of their risk management strategy. The primary purpose of holding Treasury bonds is to protect the investment portfolio from significant downturns and potential systemic risks that may occur during market peaks. When the stock market is at high levels and facing adjustments, the stable returns of U.S. Treasury bonds can partially offset losses from stock investments, providing a degree of safety cushion for the investment portfolio.
When the stock market’s baseline is relatively high, strategically allocating U.S. Treasury bonds can be an effective risk management tool. Once the market experiences a downturn, a significant amount of capital moves from stocks to the highly reputable U.S. Treasury bond market in search of a haven. This shift is due to U.S. Treasury bonds being considered one of the safest assets globally, especially during market panic, where investors naturally redirect their funds to the bond market.
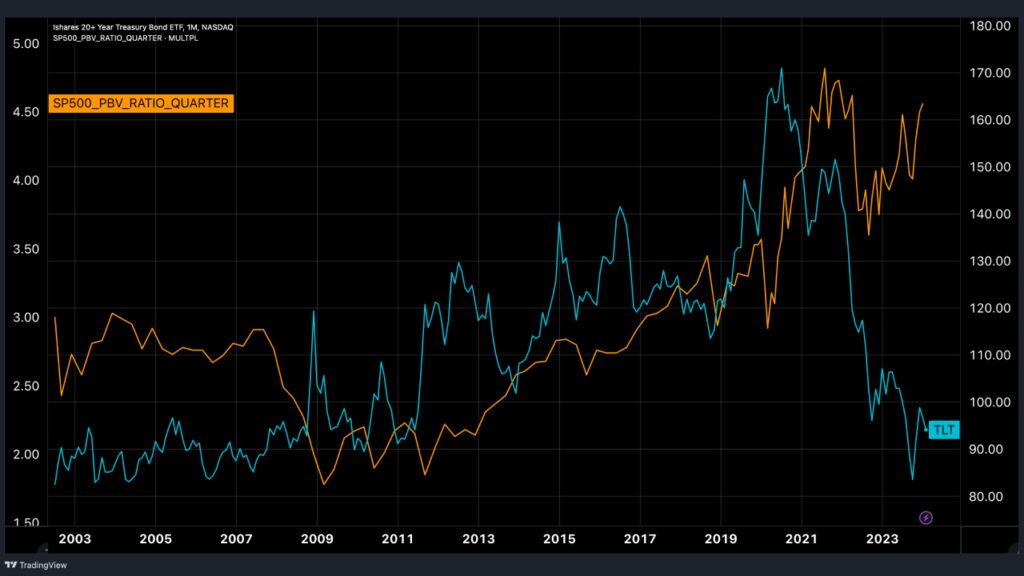
From the comparative analysis between TLT (an ETF composed of U.S. Treasury bonds with maturities of 20 years or more, represented by the orange line) and the S&P 500 Price-to-Book value ratio (blue line), we can observe an interesting phenomenon: whenever there’s a significant drop in the S&P 500 Price to NAV ratio, the price of U.S. Treasury bonds correspondingly rises. This indicates that while the stock and bond markets are not perfectly inversely correlated, they have a significant substitution relationship. This substitution effect can protect the portfolio during high periods in the stock market, reducing potential losses.
For example, during the stock market downturn in the first quarter of 2020, U.S. Treasury bond ETFs performed exceptionally well, becoming a highlight in the market. At this time, realizing profits from U.S. Treasury bonds and reallocating capital to the stock market, which has a lower baseline, can achieve an ideal hedging effect.
A common strategy for stock/bond allocation treats the stock market as the primary investment target, with the bond market as a secondary option, primarily because bonds are usually seen as a hedging tool.
For overall capital allocation, about 80% of the funds could be allocated to the stock market, with 20% allocated to the bond market.
Regarding the allocation in the stock market, 70% of the funds could be invested in the market when systemic risk arises, i.e., when there is a significant downturn in the stock market. The remaining 30% could be reserved for short-term investments when stock prices are below average.
This strategy aims to ensure the continuation of stock market growth in the short term. This way, even when the market baseline is high, good investment opportunities are not missed, and when a stock market crash occurs, there will be sufficient funds to buy in at lower prices.
This allocation aims to ensure growth opportunities are not missed during upward trends in the stock market while retaining sufficient funds to buy in during market lows. This approach maintains healthy growth in the investment portfolio under different market conditions and strikes a balance between risk and opportunity.
Next, we delve into the third decision-making aspect for cyclical investors: when to buy. Various strategies exist to determine the optimal time to enter the market. By employing the principle of mean reversion, investors can identify moments when the market is overheated or undervalued, thereby making more rational investment decisions.
The Price-to-Book Ratio (P/B ratio) is a metric used by investors to assess the value of a company. It divides the company’s market price (per share) by its net assets per share (the company’s net assets divided by the total number of issued shares).
The P/B ratio helps investors determine whether a company’s stock is overvalued or undervalued. A high P/B ratio indicates that investors are willing to pay a higher price for the company’s stock, which may suggest that the stock is overvalued. Conversely, a low P/B ratio suggests that investors can buy the company’s stock at a lower price, potentially indicating that the stock is undervalued.
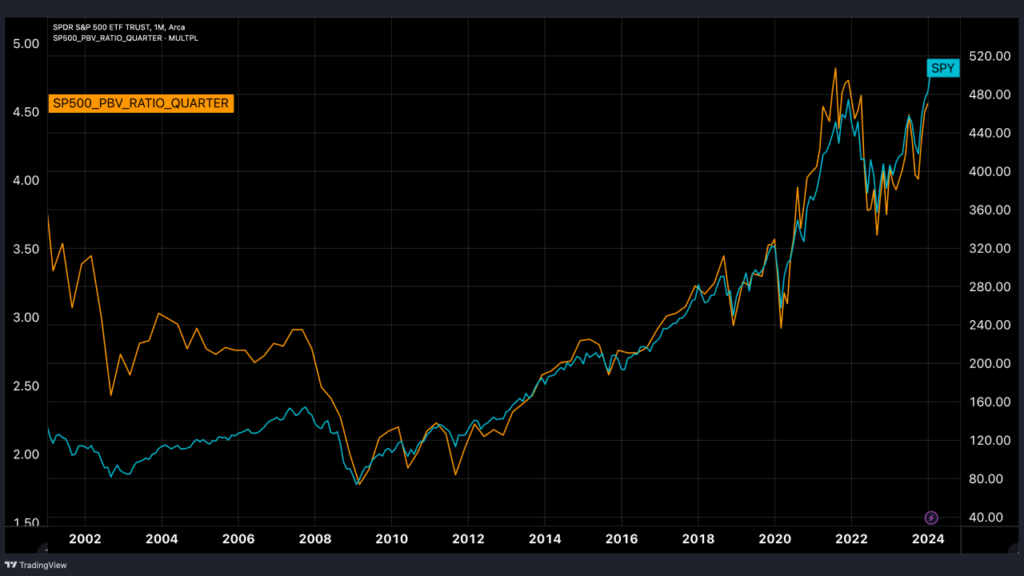
Observation of the S&P 500 Index and its market P/B ratio over the past twenty years reveals critical moments of mid-term pullbacks or moderate corrections, clearly indicated by downward-pointing red arrows. These moments have served as signals for capital investment.
A market P/B ratio falling below 1.6 is often a signal for undertaking systematic risk investments. At this stage, the market shows signs of systemic collapse, offering attractive entry points for investors. The periods marked with red circles represent past significant pullbacks and the emergence of systemic risks.
From a macro perspective, each major pullback was accompanied by unique historical contexts:
These periods presented opportunities for large-scale capital investments to capture market rebounds and address systemic risks.
The KDJ indicator is derived from the Stochastic Oscillator and is a momentum indicator commonly utilized in stock market technical analysis. It comprises three lines: the K line, D line, and J line, aimed at providing more sensitive predictions of price movements and identifying overbought or oversold asset conditions.
Generally, when the J value falls below 20, it suggests that the stock might be in an oversold condition, considered a potential buying signal. Conversely, a J value above 80 indicates that the stock might be overbought, suggesting a selling opportunity.
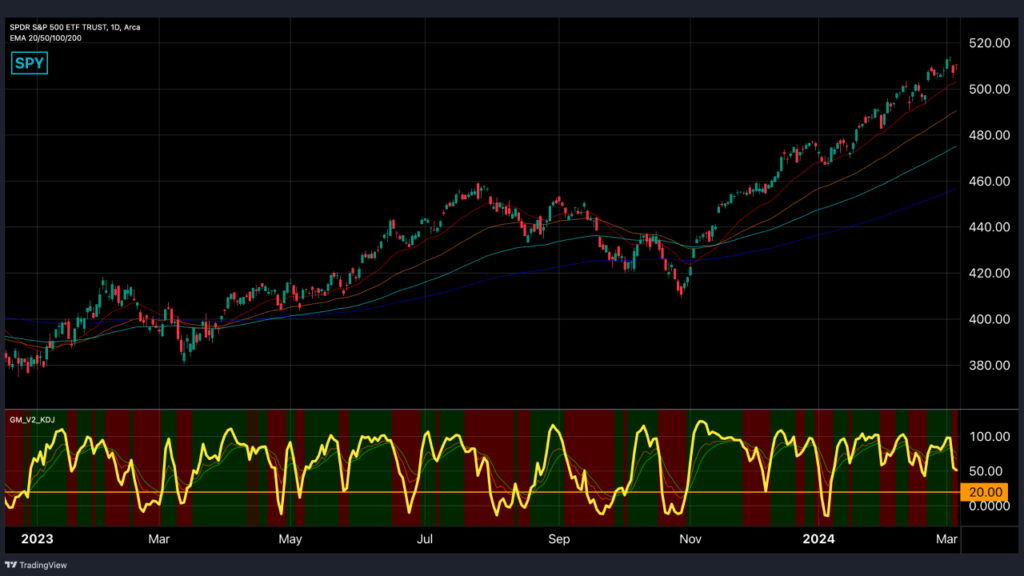
In the daily SPY chart, the bottom purple line represents the J value of the stock. A daily J value below 20 often occurs at the low point of the current price band and is viewed as an opportunity for short-term capital to establish positions. In contrast, a daily J value nearing or exceeding 100 serves as an indication to liquidate holdings, aiming to capture short-term price swing profits.
Employing this strategy allows for maximizing returns within price swings using short-term capital. However, in the face of sharp declines or systemic risk events, such as pandemics or financial crises, short-term capital may suffer significant losses rapidly. Hence, the importance of capital management is emphasized, especially when investing in daily charts with short-term capital.
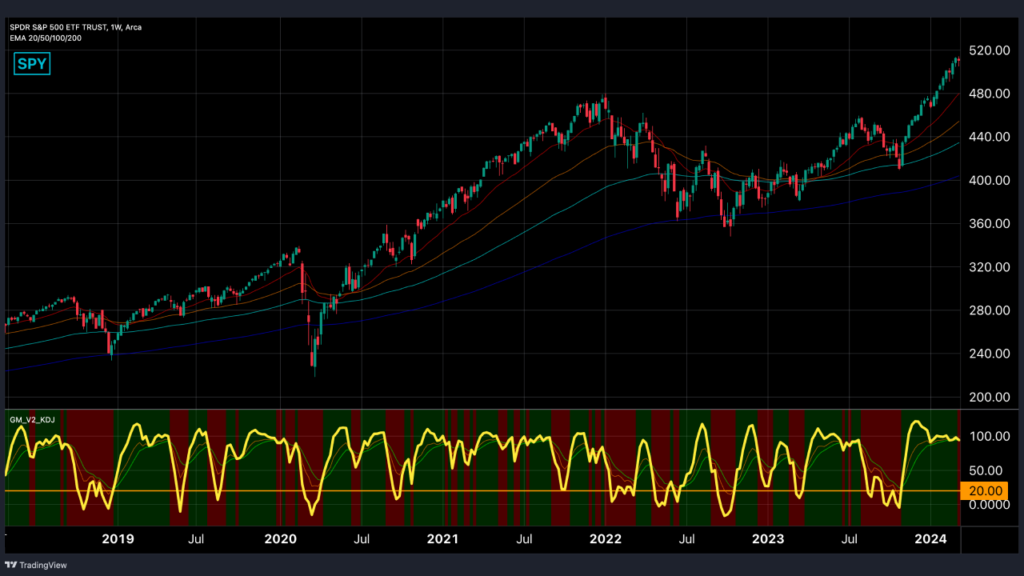
Switching to the weekly chart, a weekly J value dropping below 20 often signals stock market crashes or sudden price drops after prolonged high base periods. This could be considered an opportunity to invest long-term capital.
This strategy requires investors to adjust their investment approaches based on risk tolerance and objectives.
The Disparity Index(same as the Bias ratio) measures the percentage difference between the price of a financial asset and its moving average. This metric is utilized to gauge the extent of asset overbought or oversold conditions. Calculating the disparity index can reveal the strength of the asset’s price trend and potential turning points, which is crucial for identifying whether the market is overheated or too cool.
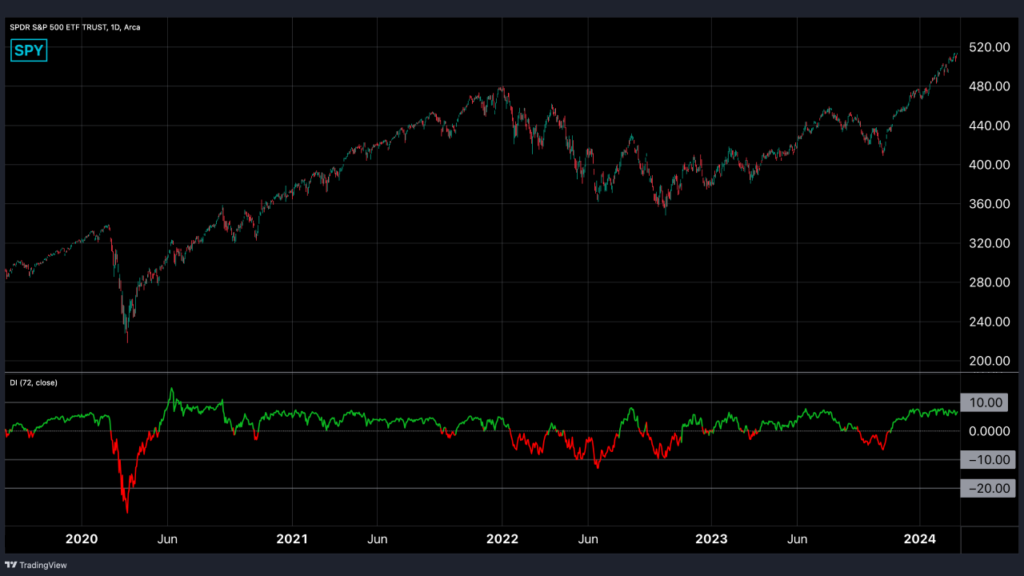
The chart for SPY (tracking the S&P 500 Index) demonstrates that its long-term disparity index generally stays within a range of 10% to -10 %.
When the disparity index returns to the zero axis, approaching its fundamental price level, it’s an opportunity for short-term capital investment. Suppose the index falls below the zero axis, nearing -10 %. In that case, it signals the time for medium-term capital investment, continuing until it drops below 10%, at which point long-term capital should be deployed. This strategy creates a pyramid-shaped investment structure to reduce costs and realize profits when prices exceed the average.
The Fear & Greed Index is an indicator developed by CNN that is designed to measure market sentiment. It operates on a scale from 0 to 100, where 0 signifies extreme fear and 100 represents extreme greed.
This index is derived from a weighted average of seven sub-indicators:
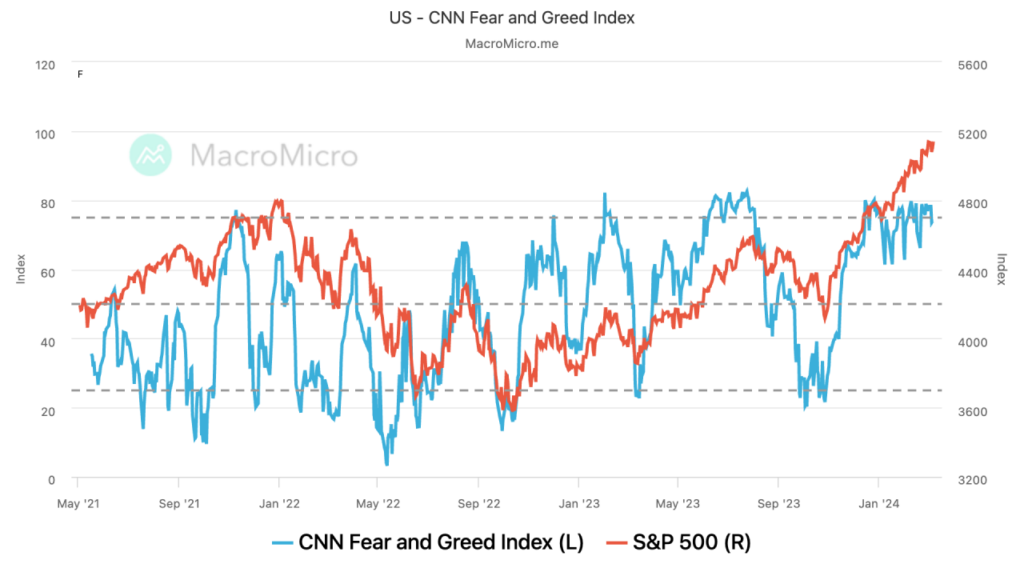
Charts of the U.S. stock market’s Fear & Greed Index illustrate greed when market liquidity is high, trading volumes spike, and prices react positively. Conversely, the index leans towards fear when trading volumes decrease, market sentiment is pessimistic, or there’s an increase in government bond purchases.
Historical data, including minor corrections in January 2021 in late 2020 and the significant stock market drop in 2020, show the Fear & Greed Index below 40, signaling opportunities for capital allocation.
For investors focusing solely on the Fear & Greed Index rather than the disparity index, one potential strategy is to adopt a long-term hold stance, or “buy and hold.” Considering the stable growth characteristic of the U.S. stock market, each market correction often provides buying opportunities. To determine if the market is in a correction phase, observe if the Fear & Greed Index falls below 40, thereby identifying opportune buying moments.
Cyclical investors focus on two main principles at the core of their approach.
Firstly, they emphasize the market’s natural cycles, recognizing that prices fluctuate above and below the average and will ultimately revert to the mean. By choosing appropriate indicators for capital management, one can maintain stability during significant market volatility, leading to asset appreciation.
Secondly, it is recognized that cyclical investing is not a short-term activity; substantial returns should not be expected within just a week or two. A long-term perspective and respect for market patterns are key to achieving investment success. The passage of time itself is considered an asset, necessitating patience to wait for the market’s natural adjustments.